As part of the Student Cluster Competition team with TACC (details here), I created a power monitoring tool using graphite and grafana. During this time I realized how powerful a tool like grafana is for sharing and cleaning visualizing data and sought to find other applications for it. Recently I installed and configured both graphite and grafana to run on my local Raspberry Pi server. Currently this is used to display my network connectivity and system usage information, but I’m looking for other applications such as temperature logging, social media data analysis, etc.
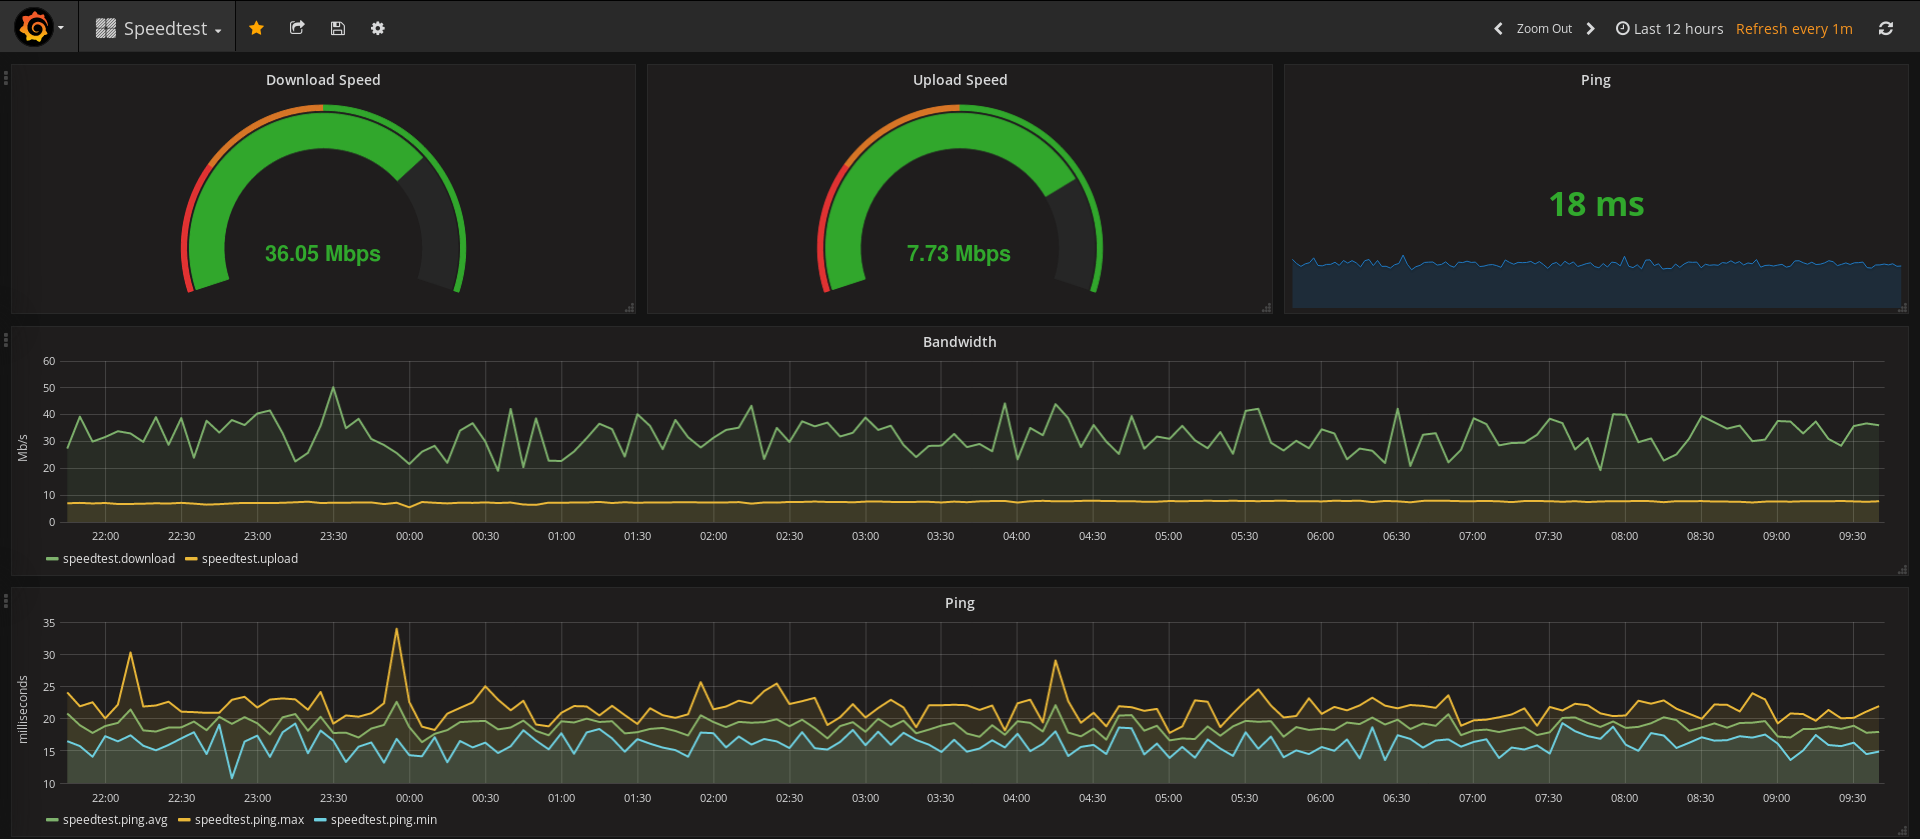
Note: The network speed data is collected through a tool called speedtest-cli, which depends on processing power to obtain accurate results. Since this is hosted on a Raspberry Pi, the data is off by a factor of at least 10. I’m searching for other ways to obtain an accurate speedtest, but for now this provides a somewhat accurate relative view to show drops in network connectivity.